Met Office 7-day forecast for Scarborough (Scarborough)
Model run at 2100, Wed 23 Sep 2026. All times UTC.| 0000 | 0300 | 0600 | 0900 | 1200 | 1500 | 1800 | 2100 | |
|---|---|---|---|---|---|---|---|---|
| Wed 23 Sep 2026 |
11.1°C ±1.0 0% : NW 3 / 10mph  |
|||||||
| Thu 24 Sep 2026 |
9.8°C ±0.3 1% ★ W 6 / 7mph |
9.1°C ±0.4 4% : WSW 6 / 8mph  |
8.6°C ±0.2 4% : SW 6 / 12mph |
10.5°C ±2.3 4% : SSW 10 / 15mph |
14.7°C ±1.9 5% : SSW 14 / 22mph |
17.3°C ±0.7 5% : SSW 14 / 23mph |
17.0°C ±1.0 5% : S 11 / 23mph |
15.2°C ±0.8 5% : SSW 9 / 22mph |
| Fri 25 Sep 2026 |
13.9°C ±0.5 0% ★ SSW 9 / 20mph |
13.5°C ±0.4 0% : SW 10 / 21mph |
12.7°C ±0.5 1% : SW 10 / 19mph  |
13.7°C ±1.5 6% : WSW 10 / 16mph |
15.9°C ±0.8 10% ★ NW 7 / 11mph |
15.9°C ±0.6 51% ★ NW 8 / 12mph  |
14.3°C ±1.1 54% ★ NW 8 / 13mph |
12.9°C ±0.4 16% ★ WNW 6 / 12mph |
| Sat 26 Sep 2026 |
12.0°C ±0.6 10% ★ WSW 7 / 13mph |
11.0°C ±0.7 1% : WSW 8 / 13mph |
9.9°C ±0.5 0% : WSW 9 / 15mph |
11.0°C ±1.6 0% : WSW 11 / 19mph  |
14.7°C ±2.0 0% : WSW 12 / 21mph  |
17.3°C ±0.6 1% : SW 13 / 21mph |
16.2°C ±1.6 2% : SW 9 / 13mph |
13.7°C ±0.9 0% : SSW 7 / 11mph |
| Sun 27 Sep 2026 |
12.4°C ±0.4 0% ★ SSW 8 / 12mph |
11.6°C ±0.4 0% : S 8 / 13mph |
10.8°C ±0.5 0% : S 9 / 15mph |
12.2°C ±1.8 1% : S 12 / 20mph |
15.8°C ±1.8 2% : S 14 / 25mph |
18.0°C ±0.5 13% ★ S 15 / 25mph |
17.1°C ±1.0 33% ★ S 13 / 20mph  |
15.4°C ±0.8 8% : SW 10 / 16mph |
| Mon 28 Sep 2026 |
13.9°C ±0.8 7% ★ SW 9 / 14mph |
12.4°C ±0.7 3% : WSW 8 / 12mph |
11.0°C ±0.8 2% : WSW 8 / 11mph |
11.6°C ±1.4 3% : WSW 8 / 14mph |
14.6°C ±1.6 1% : WSW 8 / 16mph |
16.4°C ±0.2 5% : SSE 10 / 16mph |
15.1°C ±1.4 4% : SE 10 / 13mph |
13.3°C ±0.4 5% : SE 9 / 13mph |
| Tue 29 Sep 2026 |
13.4°C ±0.2 6% ★ SE 9 / 15mph |
13.9°C ±0.4 11% ★ SE 11 / 17mph  |
14.7°C ±0.5 13% ★ SE 13 / 21mph |
15.8°C ±0.7 14% ★ SE 16 / 26mph |
17.4°C ±0.9 13% ★ SE 17 / 28mph |
18.6°C ±0.4 11% ★ SE 18 / 28mph |
18.6°C ±0.4 10% ★ SSE 18 / 27mph |
18.1°C ±0.1 10% ★ SSE 14 / 22mph |
Notes
This forecast originally used publicly available information from the Met Office's DataPoint service. This is being discontinued in late 2025 (and was increasing unreliable running up to that date), and is replaced by the DataHub service. Which is being used for the above forecast.DataHub is more complex to process, but provides more information and better global coverage. Each table cell above contains, in order:
- The predicted temperature, in degrees Celsius. DataHub provides a maximum and a minimum, and I've averaged these and given the possible variation (the ± figure).
Maxima over 25°C and 30°C are highlighted thusly.
Similarly, minima below 5°C and 0°C are highlighted. - The next line contains the probablity of any precipitation (rain, mostly), followed by...
- ...the wind direction.
- The final text line gives the predicted average wind, followed by the maximum gust. DataHub uses m/sec, but I've converted these to mph.
Calm weather (≤5mph wind), strong gusts (≥25mph) and storm-force gusts (≥40mph) are highlighted. - Finally, there's an icon representing the prevailing weather type.
Select another location from the list below the table.
Rain radar
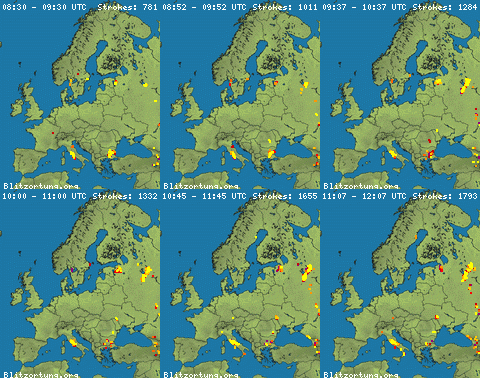
Lightning
Links
Weather warningsNetWeather radar
Clouds, Lightning, Wind
Cities (from Time & Date): Leeds, Manchester,
London, Lusaka
Credits
Data courtesy of the Met Office DataHub service.Contains public sector information licensed under the Open Government Licence.
Analysis coding by Admin1, written in Python.